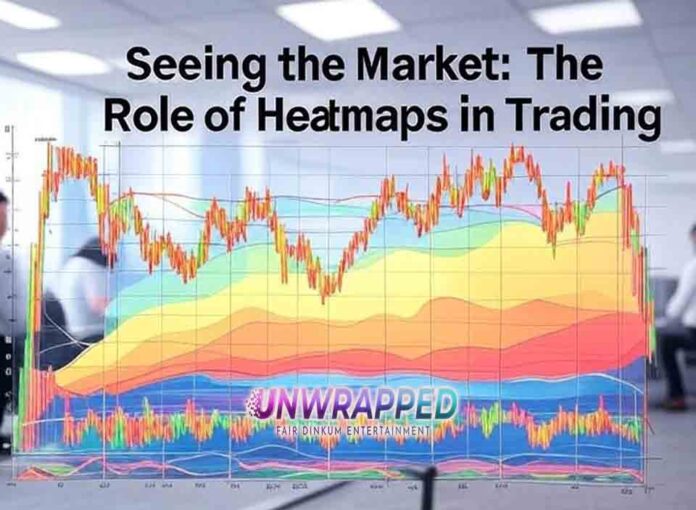
Introduction to Heatmaps in Trading
In the dynamic world of trading, staying ahead of market trends and making informed decisions are pivotal for success. One tool that has revolutionized this process is the heatmap, a visual representation that provides traders with an intuitive grasp of market conditions. This article delves into the significance of heatmaps in trading, exploring their role in enhancing decision-making and strategy development.
Understanding the Basics of Market Heatmaps
Market heatmaps are graphical representations that use color coding to depict various data points, allowing traders to quickly assess market performance and trends. These visual tools have gained popularity due to their ability to simplify complex data sets into easily digestible formats.
- Color Coding: Heatmaps typically use a spectrum of colors, with warmer colors indicating high activity or value and cooler colors representing low activity or value.
- Data Points: They incorporate various metrics such as price changes, trading volumes, and volatility levels, providing a comprehensive overview of market dynamics.
- Real-Time Updates: Many platforms offer real-time heatmap updates, ensuring traders are always equipped with the latest information.
Bookmap, for instance, is renowned for offering advanced heatmap solutions that provide traders with a clear view of market liquidity and order flow dynamics.
How Heatmaps Enhance Trading Strategies
Incorporating heatmaps into trading strategies can significantly improve decision-making processes. Here are some key ways they contribute to more effective trading:
- Identifying Opportunities: By highlighting areas of high trading activity or significant price movement, heatmaps help traders pinpoint potential investment opportunities.
- Risk Management: Understanding market conditions through heatmaps allows traders to adjust their strategies accordingly, mitigating risks associated with volatile markets.
- Pattern Recognition: Traders can identify repeating patterns and trends that may indicate future market behavior, enabling proactive strategy adjustments.
- Enhanced Market Depth Analysis: Tools like Bookmap provide detailed insights into market depth, assisting traders in understanding where major buy and sell orders are placed.
Key Features of Effective Heatmaps
Not all heatmaps are created equal. Effective heatmaps possess several features that enhance their utility:
- Customizability: Traders should be able to tailor heatmaps according to their specific needs and preferences.
- User-Friendly Interface: A simple and intuitive interface ensures that traders can quickly interpret data without confusion.
- Comprehensive Data Integration: Incorporating multiple data sources enhances the depth and accuracy of insights provided by the heatmap.
- Scalability: Effective heatmaps should accommodate both short-term intraday analyses and long-term market assessments.
Bookmap excels in providing customizable and comprehensive heatmap tools that cater to diverse trading requirements.
The Science Behind Heatmap Data Visualization
Heatmap technology is rooted in data visualization science, a field dedicated to transforming complex datasets into understandable visual formats.
- Data Aggregation: Large volumes of data are aggregated and processed to highlight key trends and patterns.
- Color Theory Application: Strategic color use enhances the visual appeal and interpretability of information presented within a heatmap.
- Algorithmic Processing: Sophisticated algorithms ensure that real-time data updates are accurately reflected on the heatmap display.
Understanding the science behind these processes can empower traders to harness the full potential of heatmapping tools like Bookmap for insightful market analysis.
Integrating Heatmaps into Daily Trading Routines
To maximize the benefits offered by heatmaps, traders should integrate them seamlessly into their daily routines:
- Morning Briefings: Start each trading day by reviewing overnight market developments through a heatmap overview.
- Trade Execution Support: Use real-time heatmap updates to make informed trade execution decisions throughout the day.
- Post-Trade Analysis: Evaluate daily trades by reviewing past heatmap data to identify successes and areas for improvement.
By incorporating Bookmap’s advanced heatmapping solutions, traders can maintain a consistent edge in their analytical processes.
Case Studies: Success Stories from Heatmap Users
Numerous traders have experienced significant success through the strategic use of heatmaps:
- A day trader improved his intraday profitability by using Bookmap’s heatmapping tools to identify optimal entry and exit points based on real-time order flow insights.
- An investment firm utilized customized heatmaps to refine their long-term portfolio strategy, resulting in enhanced returns over several quarters.
These examples underscore how effective application of heatmaps can lead to tangible improvements in trading outcomes.
Challenges and Limitations of Using Heatmaps
Despite their advantages, there are challenges associated with using heatmaps:
- Data Overload: Excessive information can overwhelm users if not properly filtered or customized.
- Interpretation Variability: Traders may interpret color-coded data differently based on personal biases or experiences.
- Dependence on Technology: Reliance on electronic platforms necessitates robust technical infrastructure and support systems.
Addressing these challenges requires ongoing education and adaptation as technology continues evolving alongside market demands.
Future Trends in Market Visualization Tools
The future holds exciting possibilities for advancements in market visualization technology:
- AI Integration: Artificial intelligence could further enhance predictive capabilities within heatmapping tools.
- Virtual Reality Applications: Immersive visualizations might enable deeper engagement with complex datasets through virtual reality interfaces.
- Enhanced Personalization Options: Continued innovation will likely lead toward increasingly tailored solutions designed specifically around individual trader preferences or requirements.
As these trends unfold over time—alongside contributions from pioneering platforms like Bookmap—the role played by cutting-edge visualization technologies is set only to expand further across global financial markets worldwide!


