

The weakest argument is that Britain is simply “poorer than it was in 1984.” That is not true.
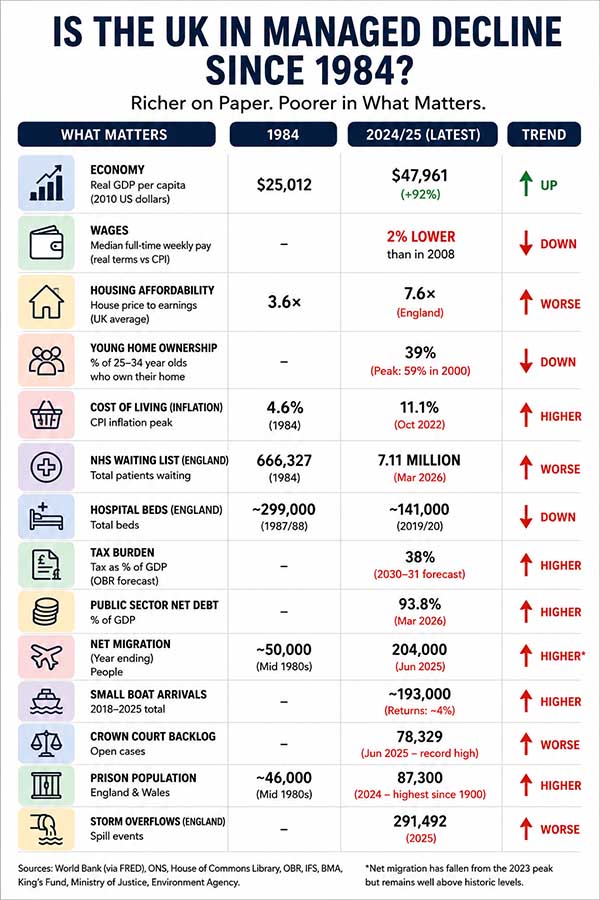
Measured by real GDP per person, the UK is much richer than it was in 1984. World Bank data published by FRED puts UK constant GDP per capita at about $25,012 in 1984 and about $47,961 in 2024, in 2010 US dollars. Real household disposable income per head also rose from £12,127 in 1984 to £25,196 in 2024, according to the Office for National Statistics.
But that is exactly why the decline argument is more powerful, not less.
Britain is not poorer on paper. It is poorer in access, confidence and competence. The country has more measured wealth, more tax, more debt, more regulation and more bureaucracy — yet ordinary people face worse access to the things that make prosperity real: a home, a doctor, timely justice, secure borders, reliable infrastructure and freedom from unnecessary state interference.
That is the honest case for UK managed decline.
Britain Got Richer, But the Basics Got Harder
Since 1984, the headline economy has grown. That part must be admitted. But the lived economy has changed in a way millions of people recognise immediately.
A young worker in 1984 was living in a poorer country statistically, but one where the path to adulthood was clearer: work, save, rent, buy, start a family. Today, Britain has higher GDP per head, but the ladder into ownership, security and independence is much harder to climb.
This is the core of the decline case: Britain became richer in aggregate while the basic promises of citizenship became harder to obtain.
The Office for National Statistics shows real household disposable income per head at £25,250 in 2019 and £25,196 in 2024. In other words, after the pandemic, inflation shock and weak growth, the average person’s real disposable income was still barely above where it had been five years earlier.
This is not a dramatic collapse. It is something more politically poisonous: stagnation.
The Post-2008 Break: Britain’s Growth Machine Stopped Working
The strongest economic case for managed decline begins not in 1984, but after the 2008 financial crisis.
ONS productivity data shows that UK market-sector multi-factor productivity in 2024 was 0.7% below 2019, and that this contrasts with trend growth of about 1.8% a year in the decade before the 2008 downturn. The ONS also says UK market-sector output growth from 2009 to 2024 averaged 1.3% a year, only about a third of the 3.2% annual growth seen from 1998 to 2007.
This matters because productivity is what pays for higher wages, better services and rising living standards. Without it, politics becomes a fight over scarcity.
That is exactly what Britain now looks like: higher taxes, higher debt, tighter public services, worse housing access, and a public increasingly told to lower its expectations.
Wages: Almost Two Lost Decades
A country can claim to be growing while workers feel stuck. Britain proves it.
House of Commons Library data says median weekly pay for full-time UK employees was £767 in April 2025, but after adjusting for CPI inflation it was still 2% lower than in 2008.
That is a brutal fact. It means a full-time worker in 2025 could look back to the year of the financial crisis and ask: what happened to nearly two decades of progress?
This is one of the cleanest ways to explain managed decline. Not national ruin. Not famine. Not total collapse. Just a slow betrayal of the promise that working hard should steadily improve your life.
Housing: The Clearest Evidence of Decline in Life Chances
The strongest single argument for British decline is housing.
In the early 1980s, buying a home was difficult, but still within the imagination of ordinary working households. Nationwide/BSA long-run data puts the UK house-price-to-earnings ratio at about 3.6 in Q1 1984.
Today, ONS housing affordability data says affordability ratios are calculated by dividing house prices by annual earnings, and the latest ONS dataset for England and Wales was released in March 2026. Recent ONS-reported figures put England’s median house price in 2025 at around 7.6 times median annual full-time earnings, with Wales around 6.0 times.
That is not a small change. That is a generational rupture.
The Institute for Fiscal Studies says that in 2022–23, only 39% of 25- to 34-year-olds owned their home, compared with a peak of 59% in 2000.
Private renters are also squeezed. ONS data for 2024 shows private renters on a median household income could expect to spend 36.3% of income on an average-priced rented home in England, above the commonly used 30% affordability threshold.
This is not just an economic problem. It is a civilisational problem. When housing becomes inheritance-dependent, the link between work and stability breaks. A society that cannot house its young cannot honestly claim to be thriving.
Cost of Living: The Shock That Broke Trust
The cost-of-living crisis did not create Britain’s decline, but it exposed it.
The House of Commons Library says UK inflation reached 11.1% in October 2022, a 41-year high. ONS data shows food and non-alcoholic drink inflation reached 19.1% in March 2023, the fastest pace for over 40 years.
Energy was just as damaging. The domestic energy price cap rose by 54% in April 2022, and even after the Energy Price Guarantee, average prices still rose 27% in October 2022.
The official inflation rate later fell. But prices did not go back to where they were. That is what many political debates deliberately miss. Lower inflation means prices are rising more slowly; it does not mean the shock has been undone.
For millions of households, the cost-of-living crisis permanently reset what normal feels like.
The NHS: More Money, More Waiting
The NHS is the emotional centre of British state legitimacy. It is also one of the clearest examples of a system that consumes more resources while delivering less certainty to the public.
The British Medical Association’s analysis of NHS England Referral to Treatment data says the waiting list in March 2026 was 7.11 million cases, covering about 6.02 million individual patients. It also says around 2.47 million patients had been waiting over 18 weeks, and about 94,000 had been waiting over a year.
That is after recent improvement. So the honest point is not that nothing ever improves. The point is that the baseline has become unacceptable.
Hospital beds tell the same story. The King’s Fund says the number of hospital beds in England has halved over the past 30 years, and that overnight beds fell by 56% between 1987/88 and 2023/24. It also notes that the UK has a low number of hospital beds by international comparison.
The state asks for more money, but the citizen waits longer. That is managed decline in one sentence.
Tax and Debt: Paying More, Getting Less
The British state is not shrinking. It is getting more expensive.
ONS data shows public sector net debt was provisionally estimated at 93.8% of GDP at the end of March 2026, a level last seen in the early 1960s. The House of Commons Library says public sector net debt stood at £2.911 trillion at the end of March 2026, equivalent to 93.8% of GDP, up from 35% of GDP in 2007/08.
The Office for Budget Responsibility forecasts National Accounts taxes rising from 36% of GDP to 38% of GDP by 2030–31, which it says would be a historical high in the UK and almost 6 percentage points above the pre-pandemic level.
This gives the decline argument its sharpest political edge: Britain is not suffering because the state disappeared. Britain is suffering because the state became larger, costlier and less effective at delivering the basics.
More tax. More debt. More waiting. More excuses.
Border Control: The Promise and the Numbers Diverged
The strongest argument on borders is not that Britain has literally “no border.” That is too easy to dismiss.
The stronger argument is that democratic promises on border control repeatedly failed to match outcomes.
ONS data shows long-term net migration fell to 204,000 in the year ending June 2025, down from 649,000 the year before. But the same ONS release says net migration had peaked at 944,000 in the year ending March 2023.
Full Fact says more people have arrived in the UK than left every year since 1994, and that net migration has not fallen below 100,000 since 1998, except during the pandemic.
Small boats are a separate but politically explosive symbol of lost control. The House of Commons Library says around 7,600 people who arrived by small boat were returned between 2018 and 2025, representing 4% of total small-boat arrivals over that period. It also says small-boat arrivals accounted for 41% of asylum claims in 2025.
This is the fact-based version of the border argument: not “there is no border,” but the public was promised control while the numbers showed repeated loss of control.
Justice: The System Is Slower Than the Crime
Crime is where the decline argument must be careful. Many long-term crime measures have improved. The ONS says the Crime Survey for England and Wales is a reliable measure of trends because it is not affected by police recording changes, and recent data showed homicide, knife-enabled crime and firearms offences falling in the year ending December 2025.
So do not claim “all crime is worse.” That is not the strongest case.
The stronger case is justice capacity.
Ministry of Justice data shows that at the end of June 2025 there were 78,329 open cases at the Crown Court, a series high. At the end of 2019, the Crown Court open caseload was 38,070. The same release says 19,164 cases had been open for a year or more, also a series peak.
That is the real decline: even when crime is detected, justice is delayed.
A country does not need rising crime in every category to feel less orderly. It only needs victims to believe the system will not respond in time.
Prisons: Full, Pressured and Still Expanding
The prison system shows the same pattern: the state is overloaded, reactive and running out of capacity.
The House of Commons Library says there were around 87,300 prisoners in England and Wales in 2024, the highest level recorded since 1900. Ministry of Justice projections say the prison population is expected to rise to between 98,000 and 103,600 by March 2030, with a central estimate of 100,600.
That is not a picture of a confident state. It is a picture of a system permanently managing overload.
Free Speech and Non-Crime Hate Incidents: The Orwellian Edge
This is where the Orwell comparison becomes tempting — and where it must be used carefully.
Britain is not literally Orwell’s 1984. But it has developed habits that feel Orwellian: recording non-crimes, policing speech ambiguously, and expanding bureaucratic categories while failing to deliver basic order.
In March 2026, the government said non-crime hate incidents would be scrapped “to end policing of petty squabbles” and that police would be told to stop recording “everyday rows and online spats.” It said unclear guidance had led to officers being called to people’s homes over insults and routine arguments.
The honest caveat is that the official review also found NCHIs formed only a very small proportion of non-crime police demand.
But the symbolic damage is still real. A state that cannot reliably investigate burglary, process trials quickly or control borders should be extremely cautious about recording lawful speech.
Hansard records that in 2023 police made 12,183 arrests under Section 127 of the Communications Act 2003 and Section 1 of the Malicious Communications Act 1988, with 1,119 convicted and sentenced. The same debate also acknowledged that free speech is not absolute and that some online offences involve serious material such as threats, child abuse, sexual exploitation or terrorism.
That caveat matters. But the political point remains: Britain has become more comfortable with speech bureaucracy at the same time as it has become less competent at core delivery.
Infrastructure: Even the Rivers Became a Decline Symbol
A serious country should be able to keep sewage out of its rivers and seas.
Environment Agency data showed storm overflow spills in England fell in 2025 compared with 2024. But there were still 291,492 spill events in 2025, even after a 35% reduction from the previous year.
That is why the sewage issue became so powerful. It is simple. It is physical. It cannot be spun away with abstract GDP charts.
People see higher bills, polluted water and failing infrastructure. They conclude the system is not working.
Local Government: Councils at the Edge
Managed decline is also visible locally.
The Institute for Government says that between 2018 and 2023, eight local authorities issued a total of 12 section 114 notices, the mechanism often described as effective council bankruptcy. The House of Commons Library explains that a section 114 notice means a council cannot make new spending commitments and must meet to decide what to do next.
Local government is where national failure becomes daily inconvenience: fewer services, higher council tax, reduced libraries, struggling social care, potholes, planning delays and weaker local maintenance.
Again, the theme is the same: people are asked to pay more for a system that feels less capable.
The Honest Counterarguments
A strong article must admit the facts that weaken the case.
First, Britain is richer per person than in 1984 on real GDP per capita. It is also richer on real household disposable income per head.
Second, not all crime is worse. The ONS shows several serious categories, including homicide, knife-enabled crime and firearms offences, fell in the year ending December 2025.
Third, net migration has recently fallen sharply from its post-pandemic peak.
Fourth, NHS waiting lists have recently improved from their worst point, even though they remain historically high.
These points do not destroy the managed-decline argument. They refine it.
The honest claim is not that every statistic is worse than 1984. The honest claim is that Britain is richer on paper but less able to convert that wealth into security, affordability, order and confidence.
The Orwell 1984 Comparison: Not Totalitarianism, But Managed Reality
The Orwellian comparison should not be exaggerated. Britain is not a totalitarian state. People can vote, criticise the government, publish articles and protest.
But Orwell’s deeper warning was about manipulated language and managed reality.
That is where the comparison bites.
The citizen is told the economy has grown, but cannot afford a home.
The citizen is told the NHS is protected, but waits months or years.
The citizen is told taxes must rise, but services still decline.
The citizen is told borders are controlled, but the numbers repeatedly contradict the promise.
The citizen is told speech is free, but lawful expression has been recorded, investigated or chilled by vague categories.
The citizen is told infrastructure is being improved, while sewage still enters rivers and seas hundreds of thousands of times a year.
This is not 1984 in the literal sense. It is 1984 as political metaphor: a country where official language says progress, while lived experience says decline.
Final Verdict: Is the UK in Managed Decline Since 1984?
Not in the crude sense. Britain is not poorer per head than it was in 1984.
But in the more important lived sense, the case for managed decline is strong.
The UK has become a country where GDP rose but access fell. Where public spending rose but public confidence fell. Where taxes rose but service quality often deteriorated. Where the state became more expensive but less dependable. Where the young face worse housing prospects than their parents. Where working people endured nearly two lost decades of wage progress. Where healthcare, courts, prisons, borders, water, councils and infrastructure all show signs of overload.
The most accurate conclusion is this:
Britain is not in absolute per-capita economic decline since 1984. It is in post-2008 managed stagnation, with a long-term decline in the affordability, competence and legitimacy of the state’s core promises.
Or put more sharply:
The UK is richer on paper, but poorer in the things that make a country feel like it works.
Gad Saad’s “Suicidal Empathy”: The Selective Empathy Problem
Disclaimer
This article is an opinion-led analysis based on publicly available data from official and reputable sources, including the Office for National Statistics, House of Commons Library, Office for Budget Responsibility, NHS/BMA data, Ministry of Justice figures and other cited sources.
The argument made here is not that every part of the UK is worse than it was in 1984, nor that Britain is poorer in simple GDP-per-capita terms. In fact, headline GDP per person has increased since 1984. The central argument is narrower and more specific: that Britain has become richer on paper while many core measures of everyday security, affordability and state competence have worsened or stagnated, particularly since the 2008 financial crisis.
Figures may be rounded for readability, and some data may change after publication. Readers are encouraged to check the original linked sources for the most recent figures and full context.
This article is intended as political and social commentary, not as legal, financial or academic advice. Where opinion is offered, it is clearly based on the evidence presented rather than on unsupported claims.


